As the 2024 Pacific hurricane season approaches, all eyes are on the potential transition from the current El Niño conditions to a La Niña pattern later this year. This periodic shift in ocean temperatures and atmospheric circulation could have major implications for tropical cyclone activity across the eastern, central, and western Pacific basins. While models indicate La Niña is likely to emerge by late summer, other factors like sea surface temperature anomalies may counterbalance some of La Niña’s typical impacts. In this outlook, we analyze the latest forecasts, assess the historical influences of La Niña, and provide predictions for the 2024 Pacific hurricane season in each of the three basins monitored by regional meteorological agencies.
Background
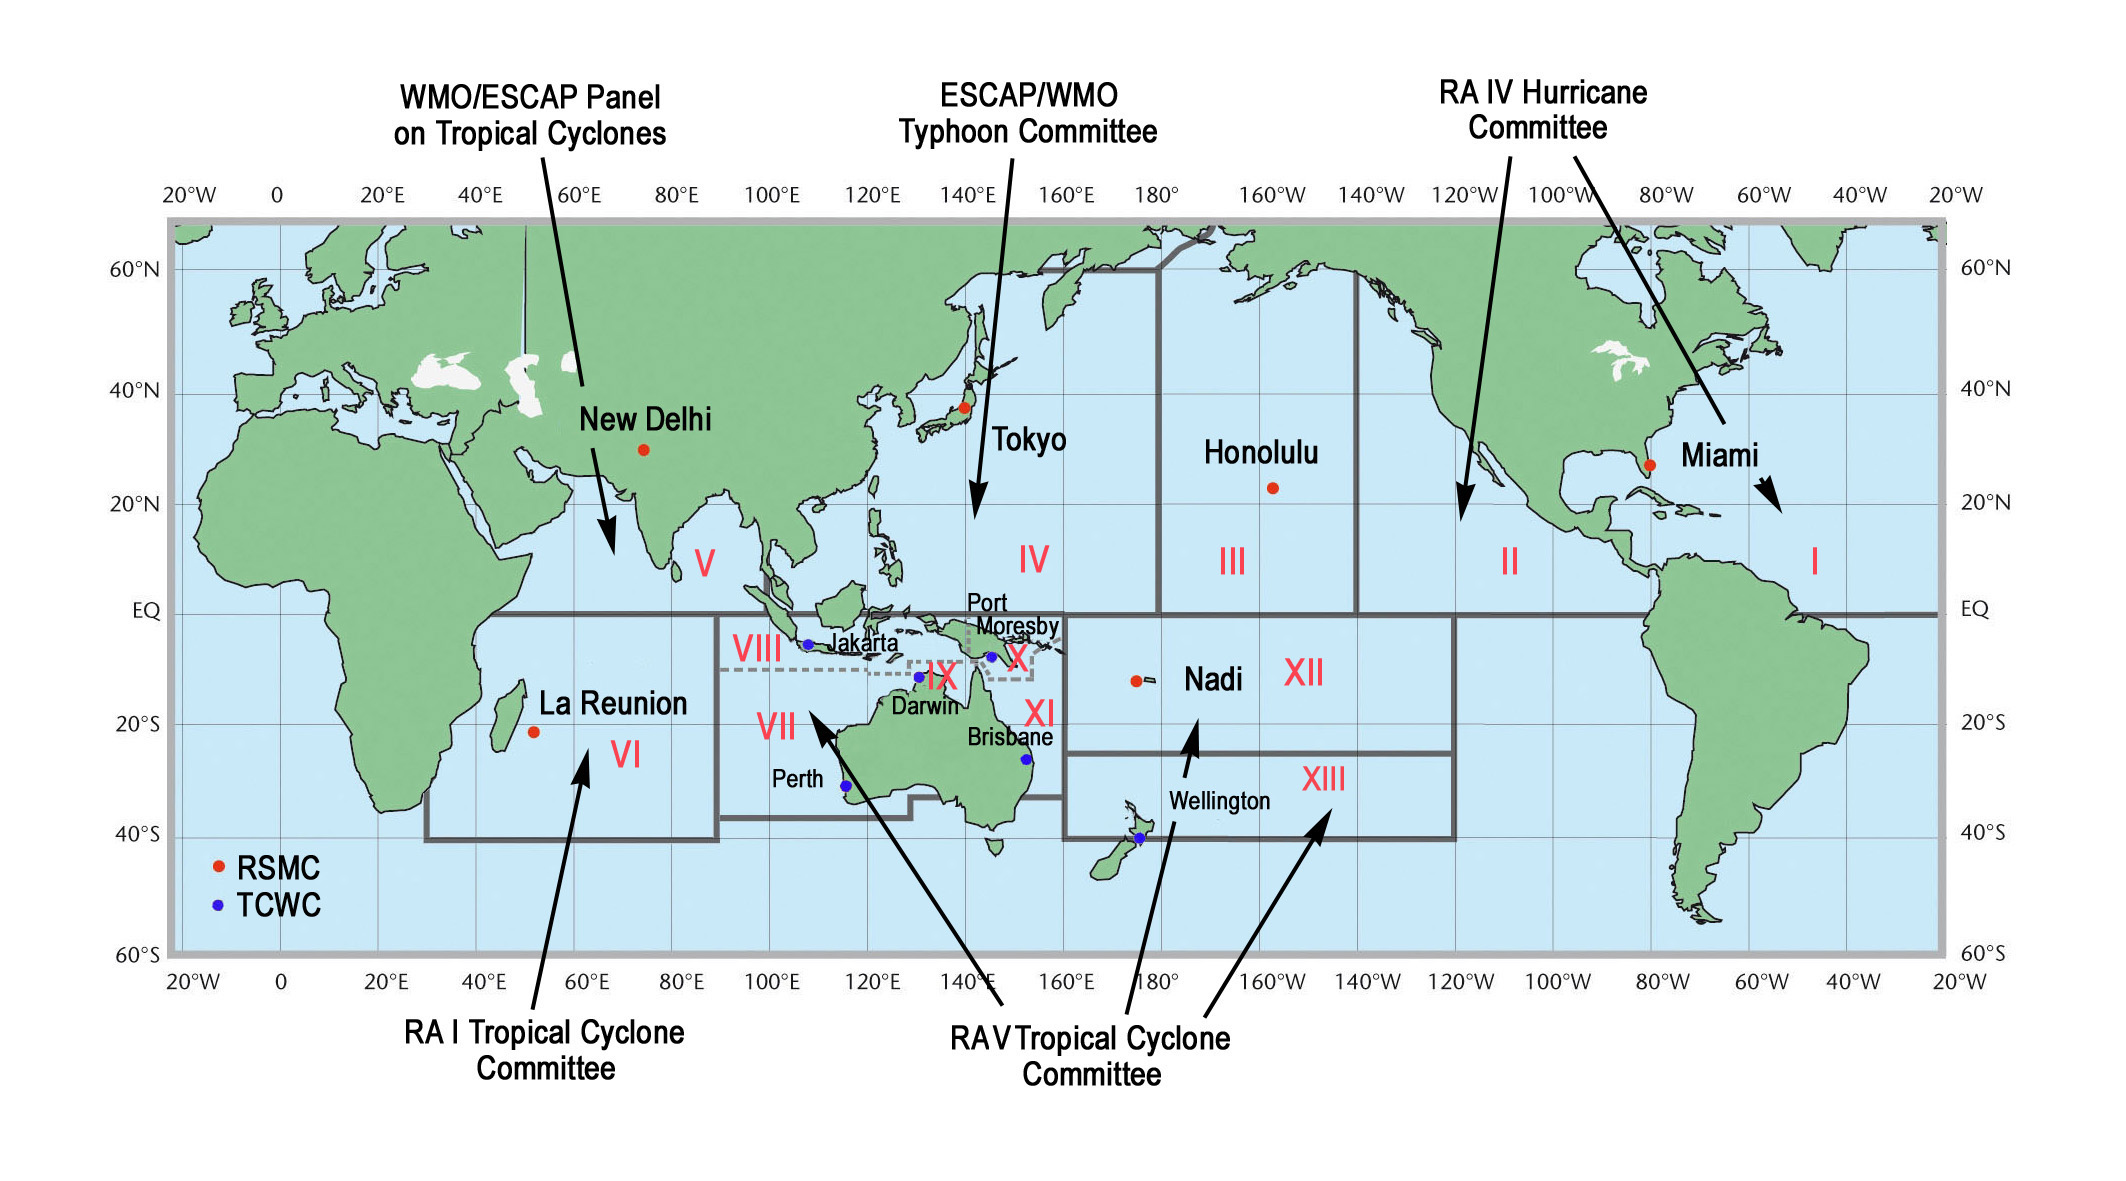
The northern Pacific Ocean is divided into three basins extending north from the equator for the purpose of hurricane forecasting (Figure 1). The eastern Pacific region extends westward from the west coast of North America to 140°W longitude. The central Pacific region covers the area from 140°W westward to the international dateline. The western Pacific region extends westward from the international dateline to 100°E longitude. Tropical cyclones that form in the eastern Pacific are tracked by the Regional Specialized Meteorological Center (RSMC) Miami, better known as the National Hurricane Center. In the central Pacific, tropical cyclones are tracked by RSMC Honolulu which is run by the National Weather Service. In the western Pacific, tropical cyclones are tracked by RSMC Tokyo which is run by the Japan Meteorological Agency.
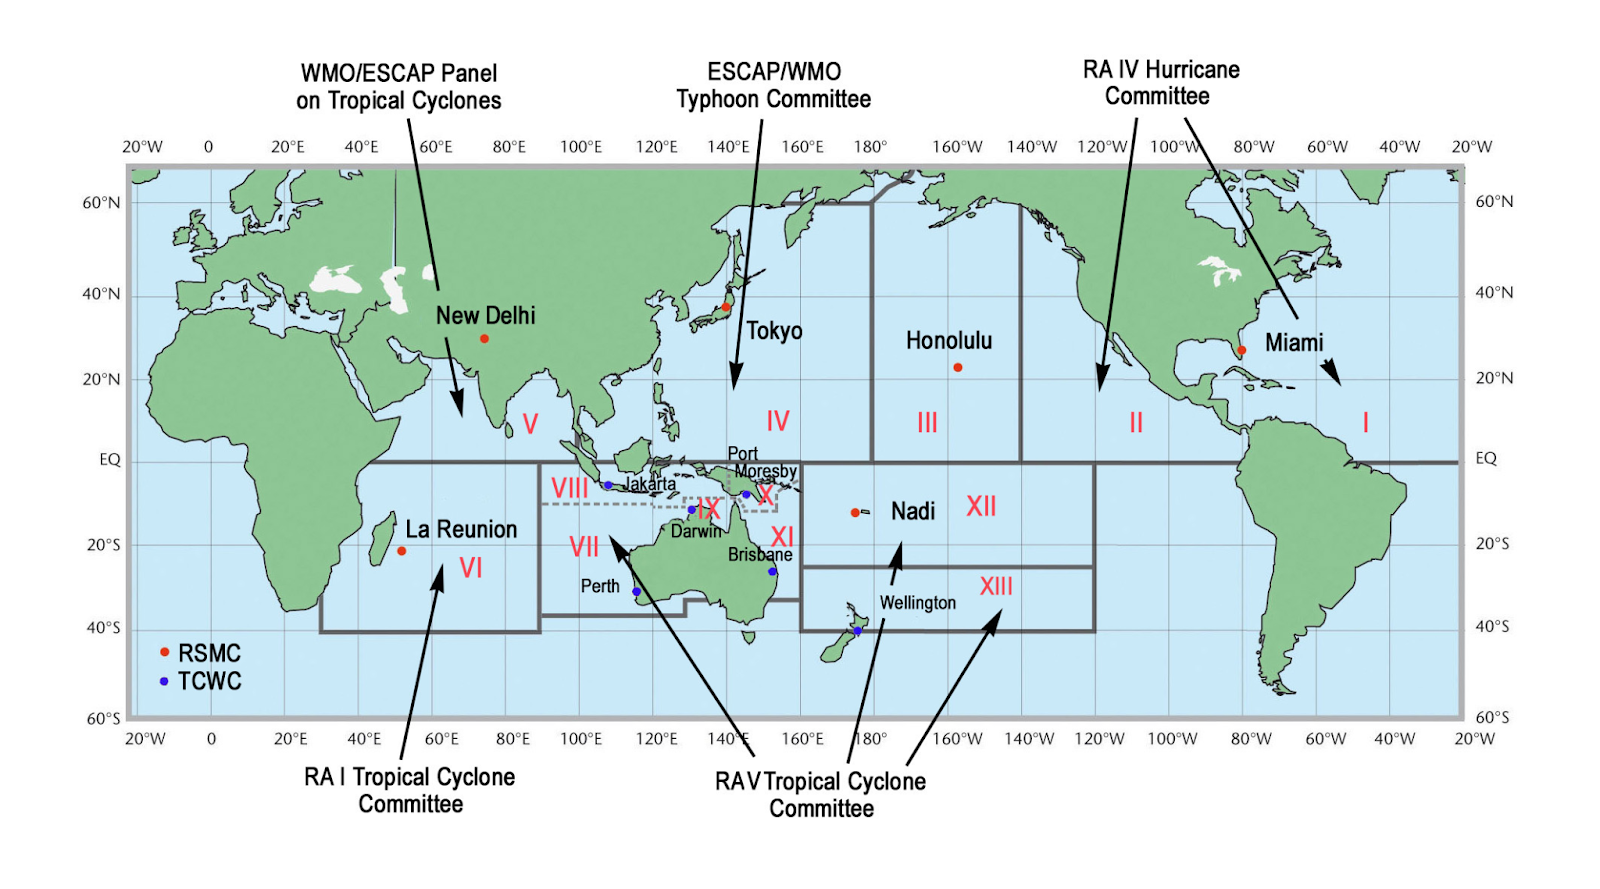
Figure 1. World Meteorological Organization Tropical Cyclone Programme
2023 Season Recap
Before we look forward to the 2024 hurricane season, let’s briefly look back at the activity in 2023. The eastern Pacific basin had a more active than normal season with 17 named storms. Of the 17 named storms, 10 became hurricanes and of the 10 hurricanes, 8 became major hurricanes (2023). In a normal season the eastern Pacific has 15 named storms, 7 hurricanes, and 3 major hurricanes (National Hurricane Center 2020). A near normal amount of four tropical cyclones were observed in the central Pacific basin (NOAA National Centers for Environmental Information 2024). The western Pacific basin had a less active than normal season with 17 named storms. Of the 17 named storms, 12 became typhoons and of the 12 typhoons, 4 became super typhoons (NOAA National Centers for Environmental Information 2024). In a normal season the western Pacific has 26 named storms, with 16 of the named storms becoming typhoons (NOAA National Centers for Environmental Information 2024).
La Niña
The 2024 hurricane season is fast approaching with an official start date of May 15 in the eastern Pacific and June 1 in the central Pacific. The season runs year-round in the western Pacific. As of early May 2024, no tropical cyclones have developed thus far this year in the Pacific Ocean. One major factor to consider for the 2024 season is the ongoing change in the El Niño-Southern Oscillation, which will have a major impact on the number of tropical cyclones that develop in the eastern and western north Pacific over the next 6 months. During the El Niño phase there are typically more tropical cyclones than average in the eastern Pacific due to weak wind shear. Conversely, during the La Niña phase, there are typically fewer hurricanes than average in the eastern Pacific due to strong wind shear (Bell 2014). ENSO is currently in the El Niño phase, but is trending toward the neutral phase by late spring, with a La Niña expected later in the season.
A combination of dynamic and statistical weather models are used to help predict changes in the ENSO phase. As shown in Figure 2, there is good model agreement that La Niña conditions develop by the late summer (The International Research Institute for Climate and Society, Columbia University Climate School 2024).
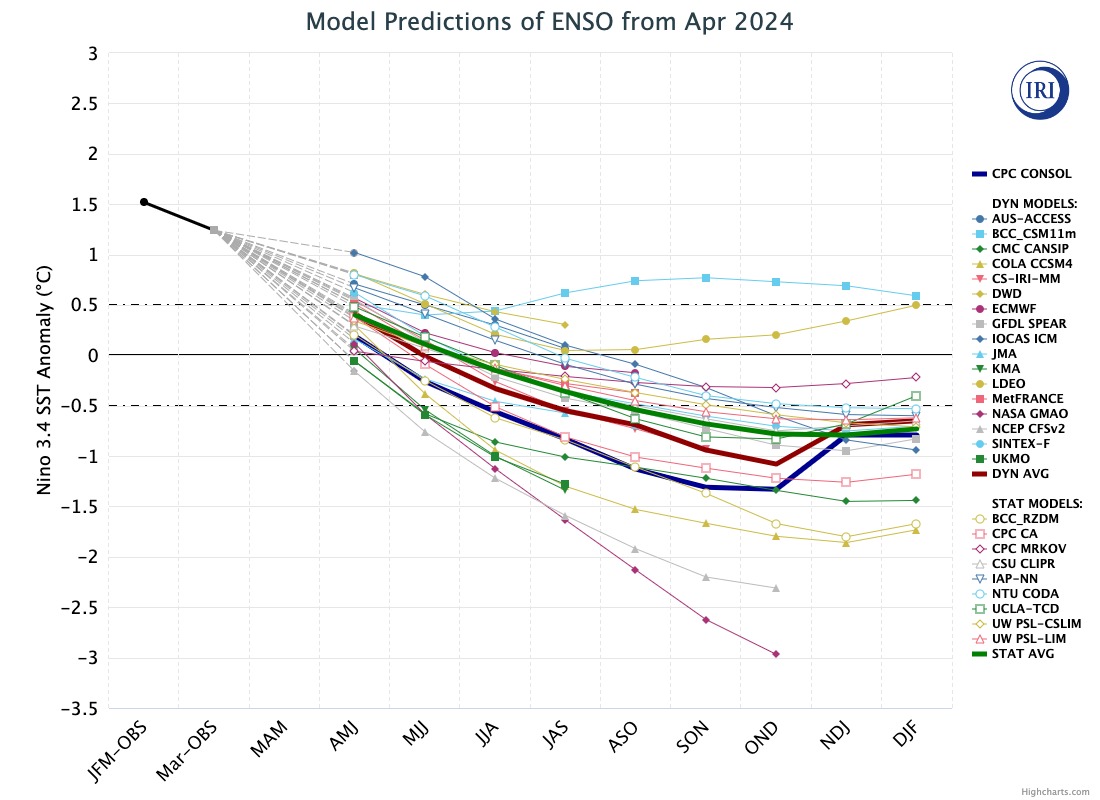
Figure 2. Model Predictions of ENSO From Apr 2024
While the models are in relatively good agreement, this time of year is referred to as the “spring predictability barrier” due to the fact that the models used to predict ENSO have the lowest skill at this time of year (L’Heureux 2015). Therefore, the output of the models is less reliable at the same lead time when compared to later in the year.
The likely development of La Niña by the peak of the hurricane season will have a major impact on the number of tropical cyclones that will develop. In a typical La Niña pattern, in addition to the previously mentioned suppression of tropical activity in the eastern Pacific, tropical cyclone development is also suppressed in the central Pacific and most of the western Pacific, with the exception of the South China Sea, which sees increased activity during La Niña (Bell 2014; Chan 2000). Tropical cyclone activity in the central Pacific is affected the same way as tropical cyclone activity is affected in the eastern Pacific (Bell 2014). In the western Pacific, changes in the upper air patterns are related to the changes in tropical cyclone activity.
Sea Surface Temperatures
Due to the likely development of La Niña by late summer, one would expect that tropical cyclone development will be below normal in the eastern Pacific. However, the latest model simulation shows near to slightly above normal tropical cyclone formation in the eastern Pacific. A possible reason for this is the potential for above normal sea surface temperatures (SST) along the coast of Mexico during much of the hurricane season as displayed in Figures 3 and 4 (TropicalTidbits 2024).
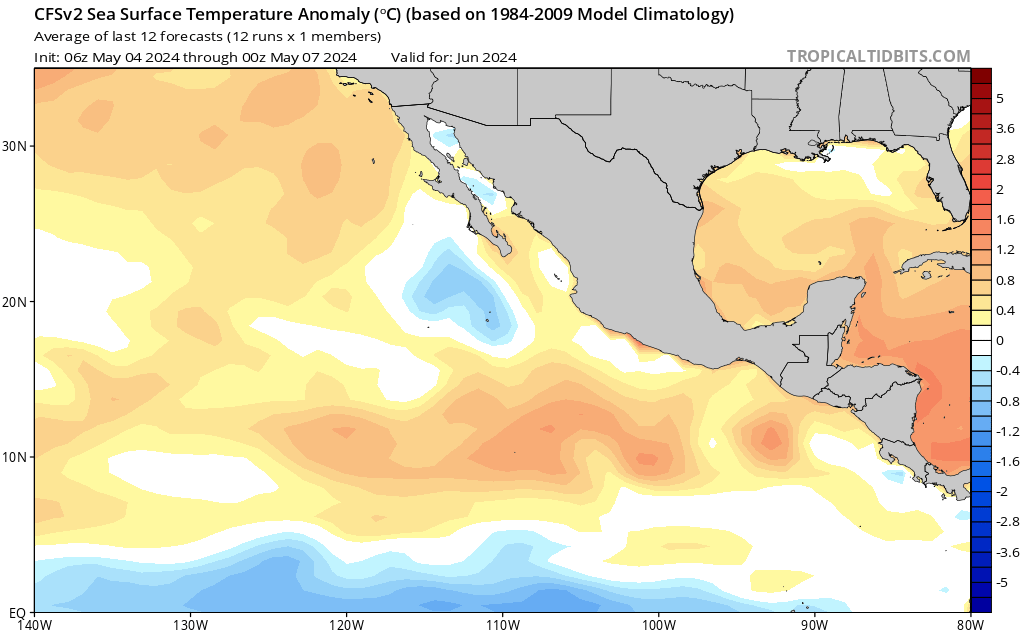
Figure 3. Forecast Sea Surface Temperature Anomalies for June 2024
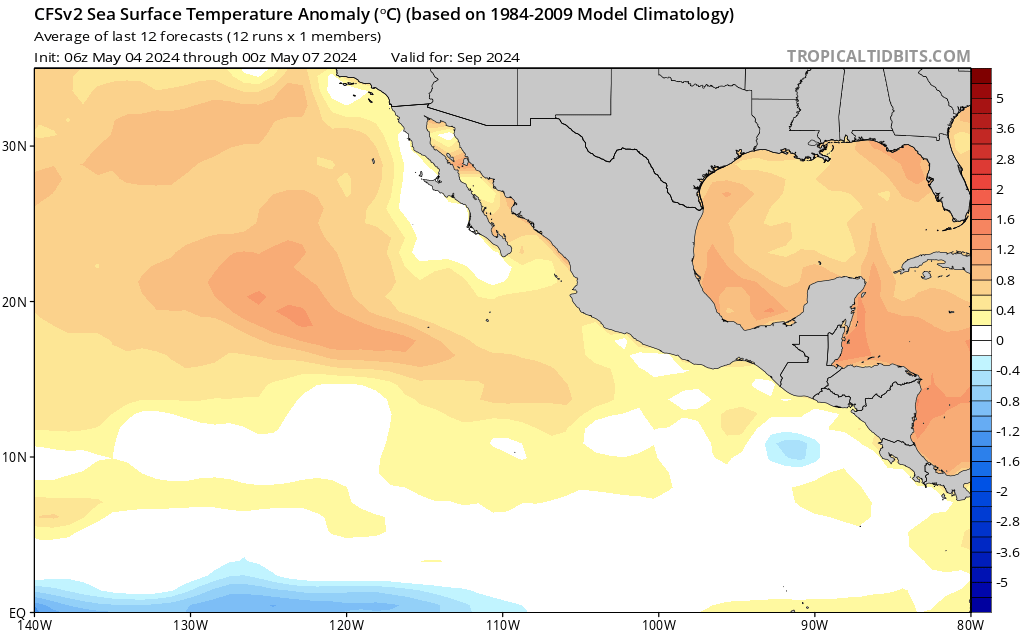
Figure 4. Forecast Sea Surface Temperature Anomalies for September 2024
As was demonstrated during the 2023 Atlantic hurricane season, warm SST can partially offset the adverse factors to hurricane formation associated with El Niño (World Meteorological Organization 2024). Despite the strong El Niño pattern, the 2023 Atlantic hurricane season had 20 named storms, which was well above the average number of 14 storms (2023).
2024 Forecast
In the western Pacific, the model mean is for a below normal amount of tropical cyclones, but there is the possibility for an above normal amount of tropical cyclones due to the combination of above normal SST and the aforementioned normal increase of tropical cyclones in the South China Sea. The ECMWF’s SEAS5 climate model simulates tropical cyclones and provides a range for the amount of tropical cyclones that can develop in the Atlantic, eastern Pacific, and western Pacific (Stockdale 2021). Figure 5 shows a model prediction of a below normal number of tropical cyclones in the western Pacific and an above normal number in the eastern Pacific.
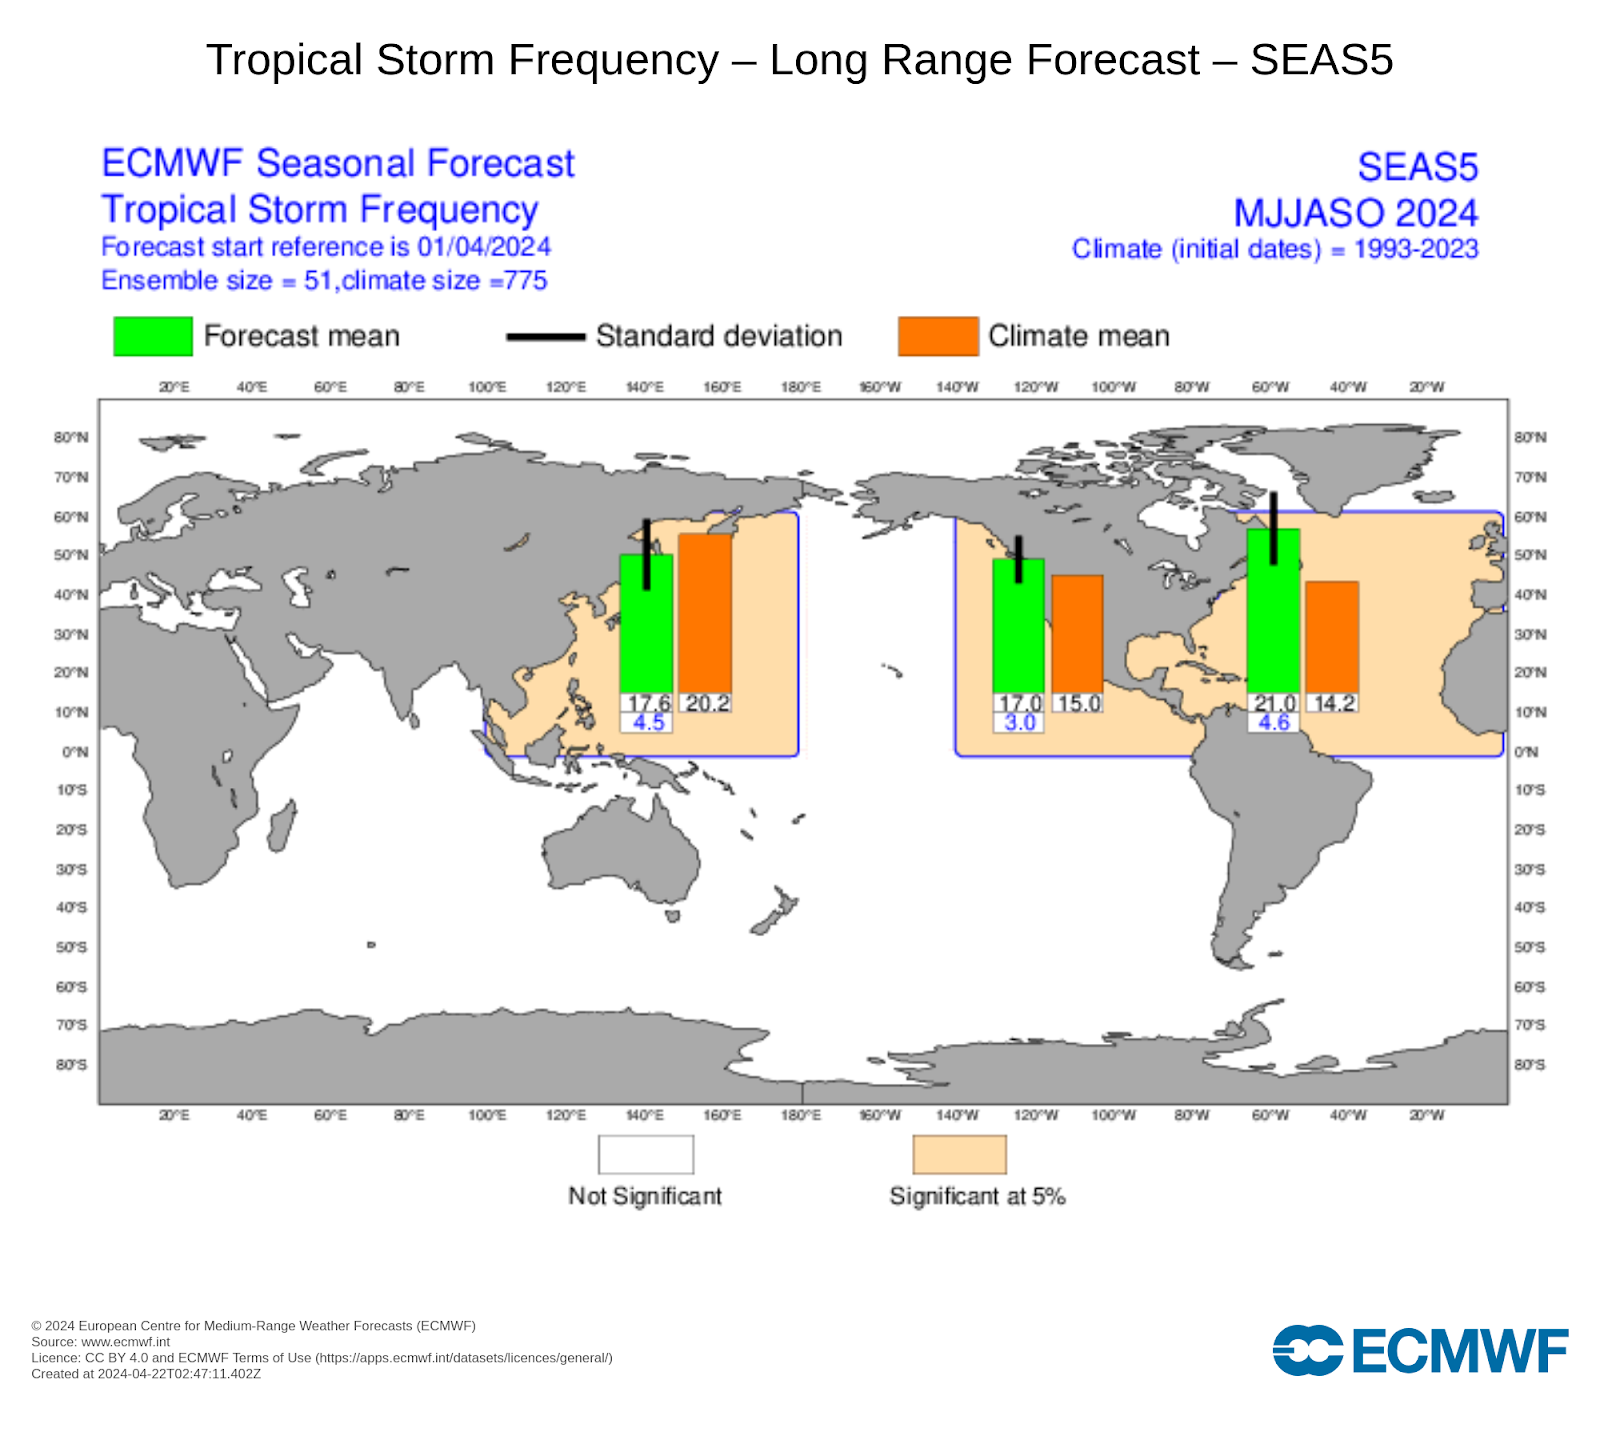
Figure 5. ECMWF Seasonal Forecast: Tropical Storm Frequency (Apr 2024)
Another way to measure the activity of a tropical cyclone season is with Accumulated Cyclone Energy (ACE). The ACE value is “based on the maximum wind speed measured at six-hour intervals over the entire time that the cyclone is classified as at least a tropical storm (wind speed of at least 39 miles per hour). Therefore, a storm’s ACE Index value accounts for both strength and duration” (US EPA 2021). The ECMWF’s SEAS5 climate model also simulates ACE. In the eastern Pacific a slightly above normal amount of ACE is forecasted while in the western Pacific a well below normal amount of ACE is likely (Figure 6).
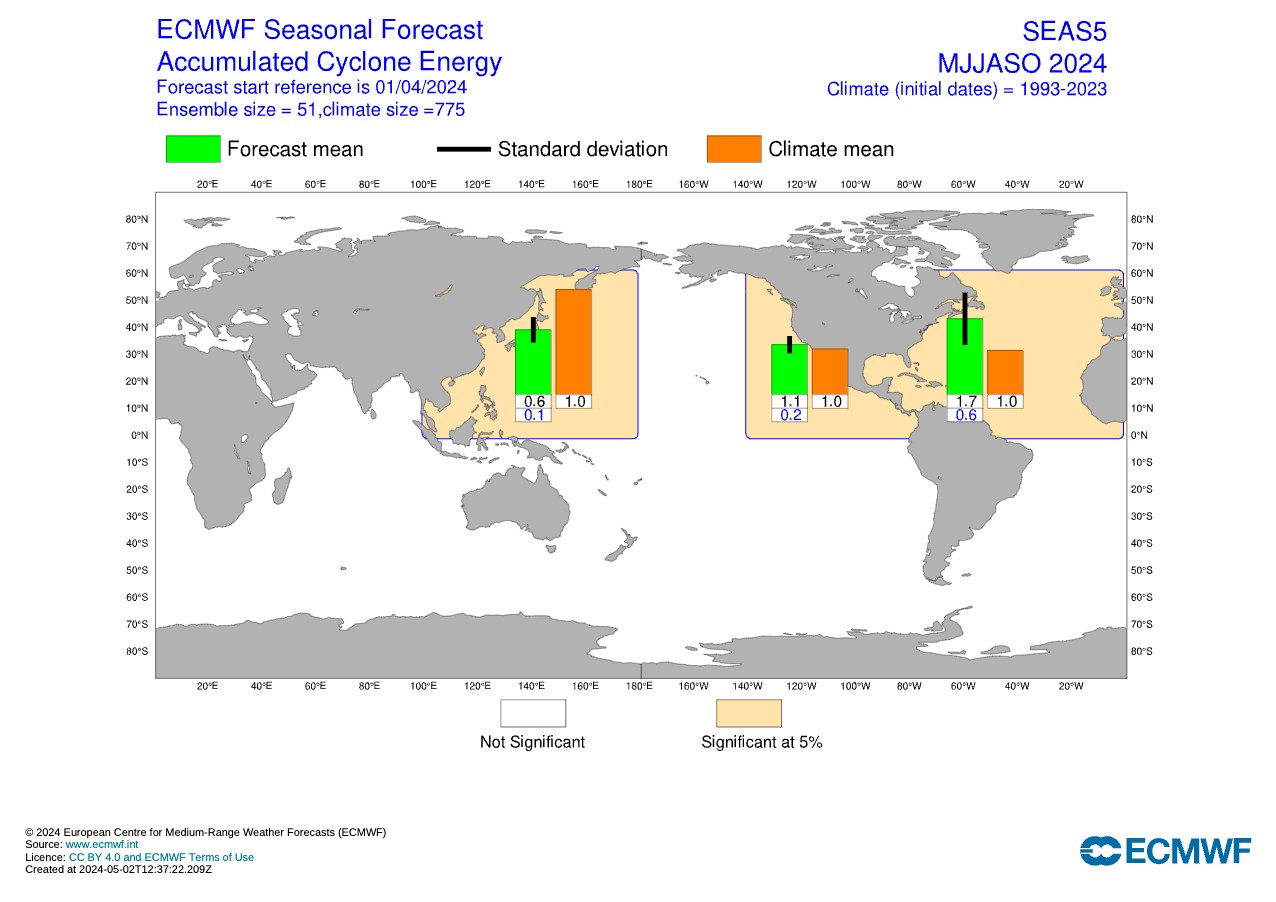
Figure 6. ECMWF Seasonal Forecast: Accumulated Cyclone Energy (Apr 2024)
Summary
The main source of uncertainty with these predictions is how quickly La Niña develops towards the peak of the hurricane season in September. Taking all factors into consideration, our predictions are for a below average number of tropical cyclones in the western Pacific and a slightly below average number of tropical cyclones in the central Pacific. In the eastern Pacific, we expect a slightly above normal amount of tropical cyclones in spite of the developing La Niña, with the main factor being the above normal SST off the coast of Mexico.
References
National Hurricane Center, 2024: World Meteorological Organization Tropical Cyclone Programme, https://www.nhc.noaa.gov/images/wmo_tcp.png (Accessed May 7, 2024).
The International Research Institute for Climate and Society, Columbia University Climate School, 2024: Model Predictions of ENSO From Apr 2024, https://iri.columbia.edu/our-expertise/climate/forecasts/enso/current/?enso_tab=enso-sst_table (Accessed May 7, 2024).
TropicalTidbits, 2024: Numerical Model Prediction, CFSv2 Sea Surface Temperature Anomaly, https://www.tropicaltidbits.com/analysis/models/?model=cfs-mon®ion=epac&pkg=ssta&runtime=2024050700&fh=4 (Accessed May 7, 2024).
L’Heureux, M., 2015: The Spring Predictability Barrier: we’d rather be on Spring Break | NOAA Climate.gov. ENSO Blog,. http://www.climate.gov/news-features/blogs/enso/spring-predictability-barrier-we%E2%80%99d-rather-be-spring-break (Accessed April 21, 2024).