In May, Pole Star Global’s FleetWeather released the 2025 Pre-Season Pacific Tropics Outlook, in which the team examined how forecast climatological patterns and general sea surface temperature anomalies were expected to shape the then-upcoming Pacific Tropics season.
Now, more than halfway through the season, the Fleetweather team is taking a fresh look at how conditions have evolved. What do current environmental conditions tell us, and how have they influenced activity in this year’s Typhoon and Eastern Pacific Hurricane seasons?
Environmental Factors: El Niño Southern Oscillation and Sea Surface Temperatures
The pre-season outlook predicted a neutral phase for the El Niño–Southern Oscillation (ENSO) during this year’s tropical season. This meant that sea surface temperatures (SSTs) across the tropical Pacific were expected to remain close to the climatological average.
As shown in Figure 1 from Mercator Ocean International, this forecast proved accurate throughout July.
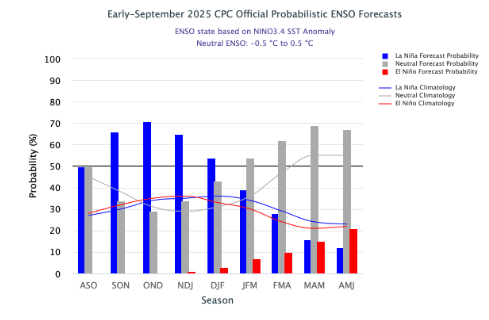
Furthermore, the Columbia Climate School’s International Research Institute for Climate and Society also confirmed that, as of mid-September, conditions remain ENSO-neutral, with a moderate chance of La Niña conditions developing over the coming northern hemisphere winter (Figure 2).
Figure 1
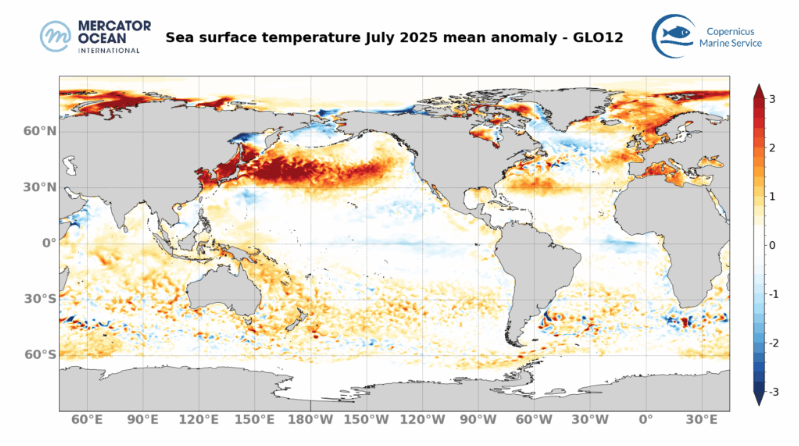
Figure 2
ENSO influences aside, other factors also contribute to SSTs, meaning temperatures can still be anomalously high or low throughout the season.
In May, Pole Star Global’s FleetWeather team forecast that SSTs closer to Central America and Mexico would trend from normal to above average. At the same time, SSTs farther west, beyond 110°W longitude, were expected to trend from normal to slightly below average.
Figure 3, from the NOAA Climate Data Assimilation System, shows that this forecast has been accurately verified. Specifically, analysis of the past 30 days shows warmer temperatures near Mexico and Central America. A higher-resolution image of the daily SST anomaly is shown in Figure 4.
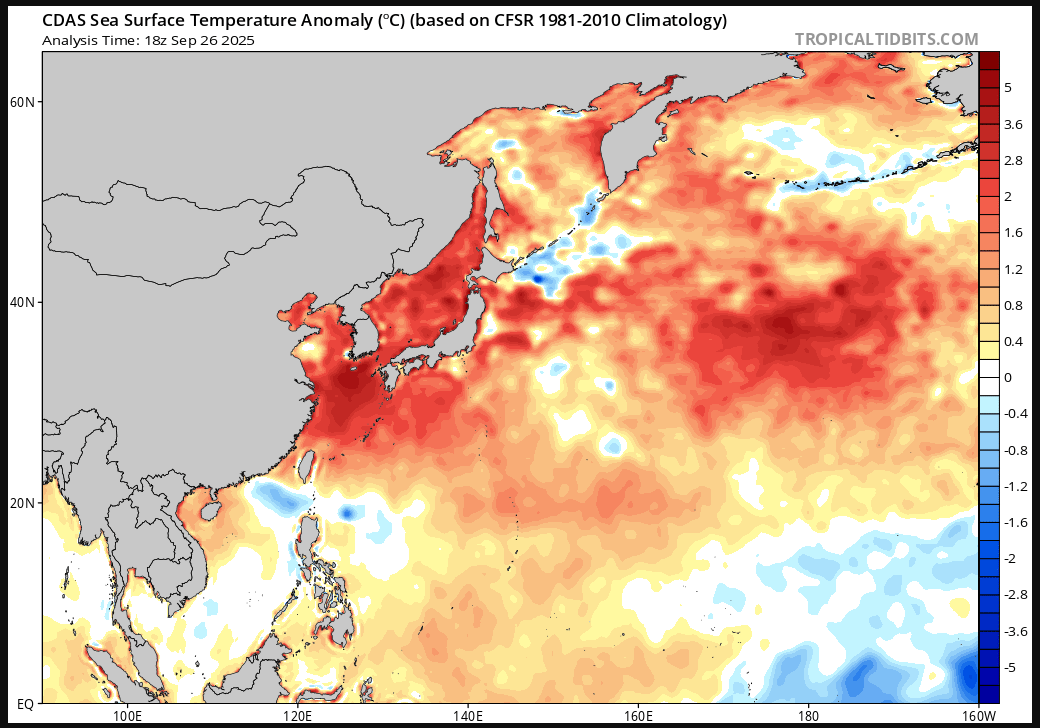
Figure 3 also shows that western Pacific tropical SSTs have trended above average, as anticipated in Pole Star Global’s May outlook, with the largest anomalies occurring further north, in the mid-latitudes east of Japan. Figure 5 provides a higher-resolution view of the western Pacific SST anomalies.
Figure 3
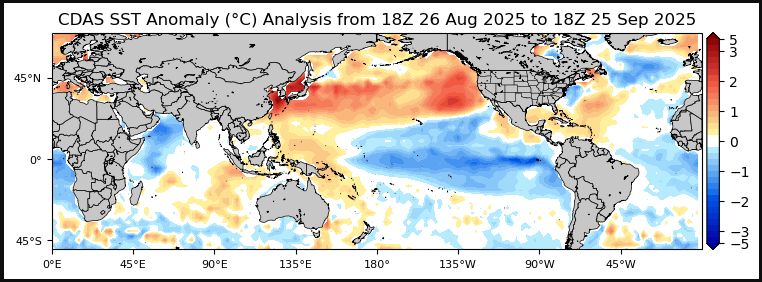
Figure 4
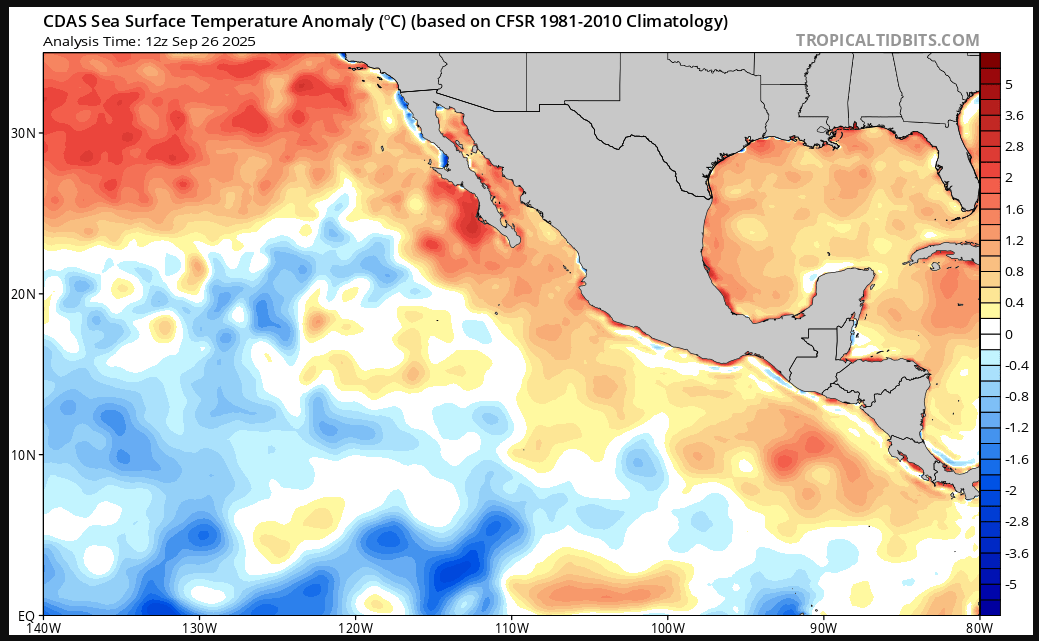
Figure 5
These SST anomalies affected both where tropical systems developed and how intense they became during their lifespans. Figure 6 shows an overlay of all named systems in the western Pacific basin as of 26 September, based on data from the Joint Typhoon Warning Center’s Best Track Data.
With warmer waters to the east of the Philippines, it can be seen that the majority of systems developed in this area. However, with the highest SST anomalies located in the mid-latitudes east of Japan, enhanced convection occurred in this region, creating unfavourable wind shear – a rapid change in wind speed or direction with height in the atmosphere – that limited tropical development in the mid-latitudes.
Figure 6
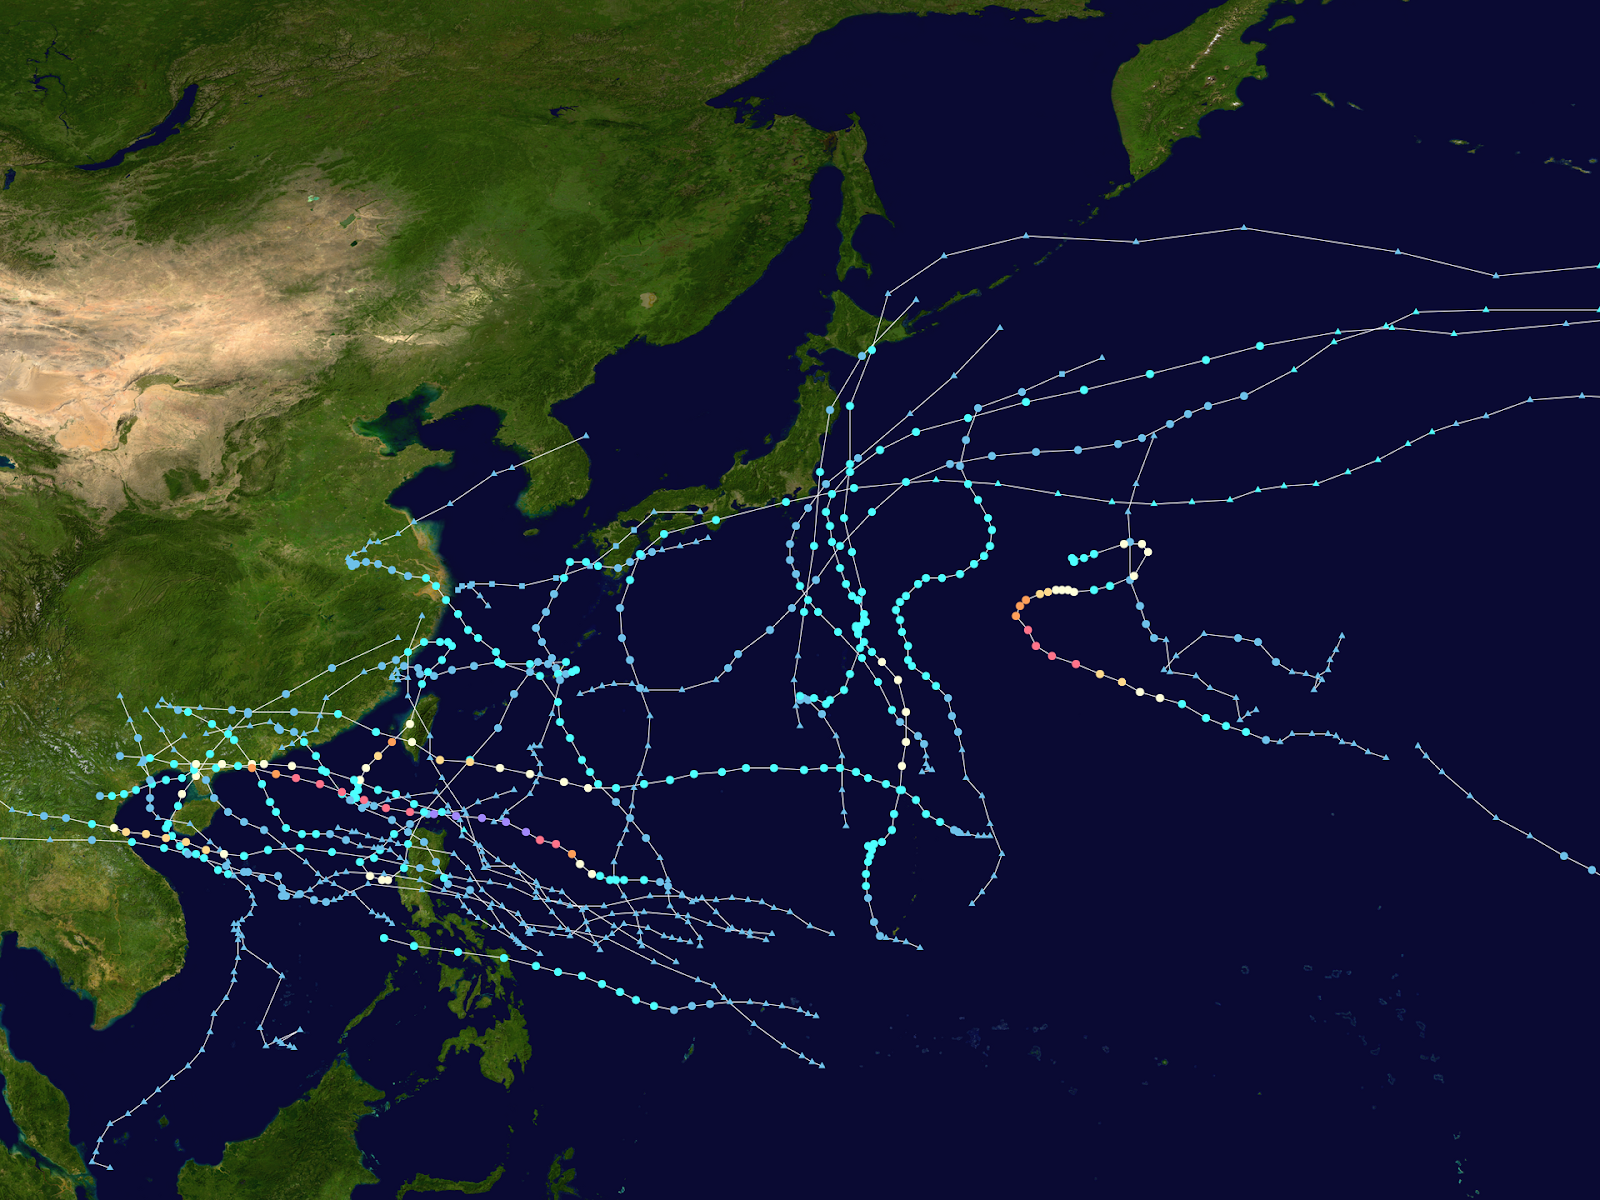
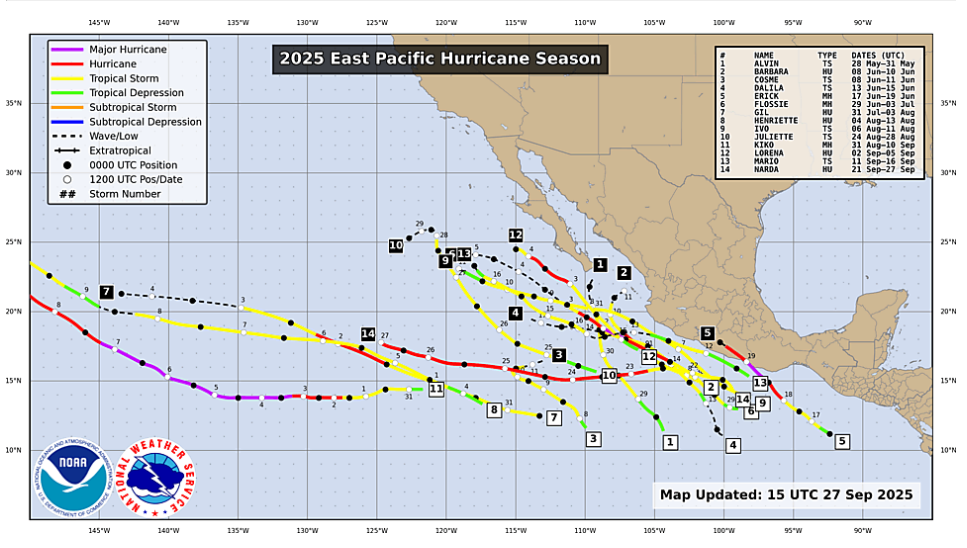
Figure 7 shows an overlay of eastern Pacific tropical systems through 27 September, produced by the National Weather Service. Typically, these systems form west of 110°W longitude. However, as shown in Figure 4, warmer waters were located further east, closer to Central America and Mexico.
Accordingly, Figure 7 shows that the majority of systems this season formed east of 110°W longitude, in line with the location of warmer SSTs.
Figure 7
Pacific Tropical Cyclone Activity Falls Just Below Seasonal Averages in 2025
Based on projected conditions and their expected impact on tropical development, this season was forecast to produce a slightly below-average number of tropical systems in both the eastern and western Pacific basins.
In the western Pacific, the season typically averages 25 named systems between June and November, with around 15 developing into typhoons. According to Colorado State University’s Department of Atmospheric Science Tropical Meteorology Department (CSU), as of 26 September there have been 21 named systems, 11 of which became typhoons, and two developed into violent typhoons (Figure 8).
As for the eastern Pacific, the seasonal average is 15 named storms, with eight developing into hurricanes. To date, CSU reports 14 named systems in the eastern Pacific, nine of which became hurricanes and four developed into major hurricanes (Figure 9).
Figure 8
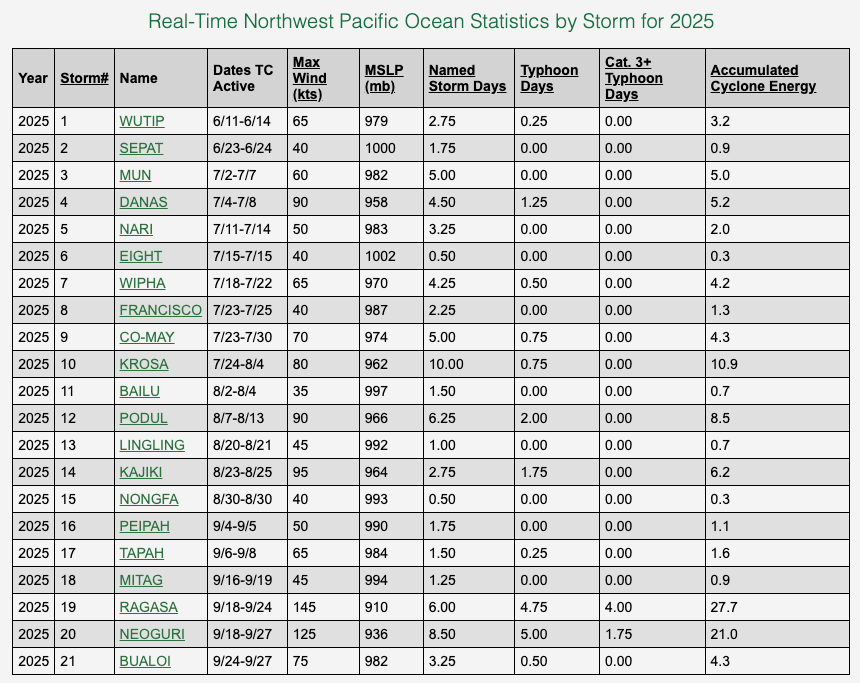
Figure 9
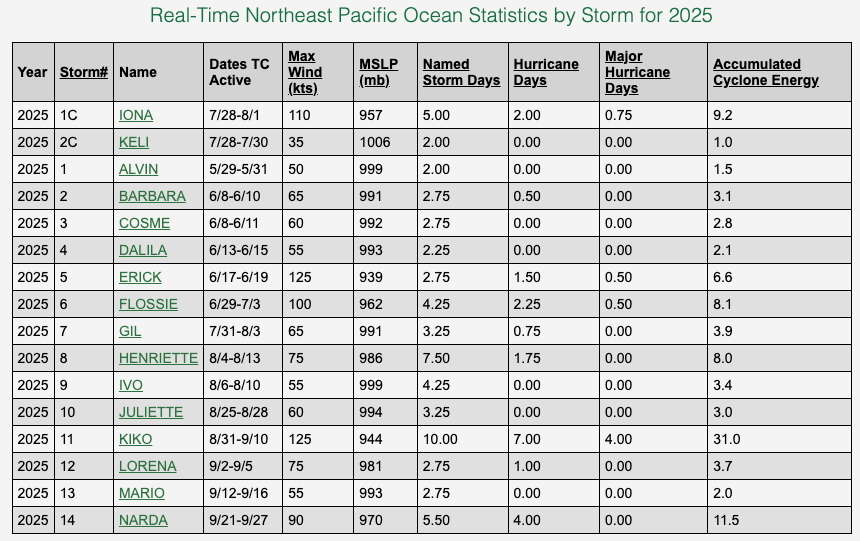
Based on these numbers, both basins currently remain just below their seasonal averages, if not rather close to the average for the eastern Pacific basin. It should be noted that the East Pacific hurricane season tends to wane much sooner, and the season is now well past its peak.
However, there is another measure meteorologists use to assess tropical season activity. The Accumulated Cyclone Energy (ACE) Index measures both the strength and duration of a tropical system once the sustained six-hour wind speed reaches 40 mph (~35 kts).
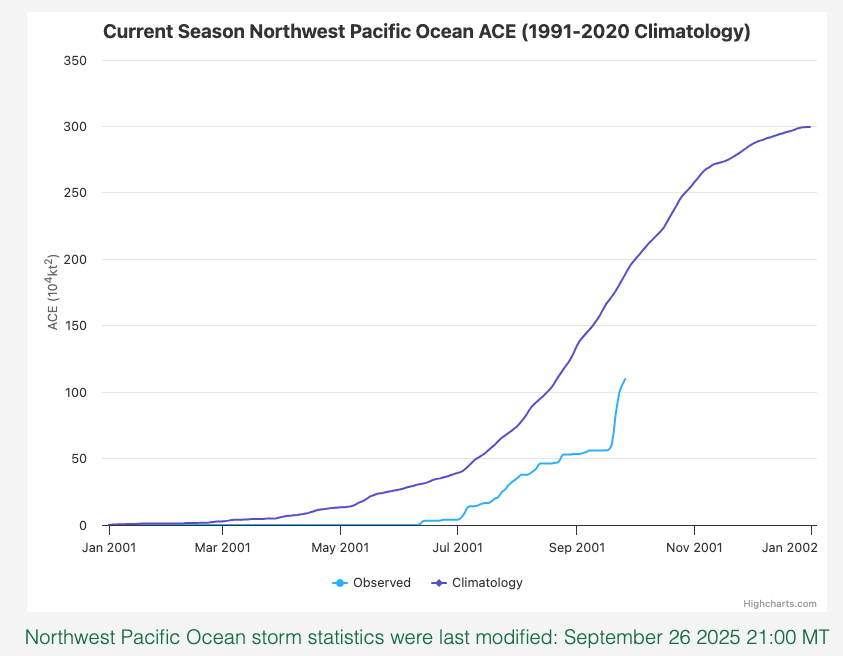
As of 26 September, CSU calculations show that the eastern Pacific systems have produced an ACE value of 100.4, slightly below the climatological average of 108 (Figure 10). Western Pacific systems have produced an ACE value of 109.8, compared with the climatological average of 188.5 (Figure 11). These data indicate that both regions are currently experiencing below-average tropical activity.
Figure 10
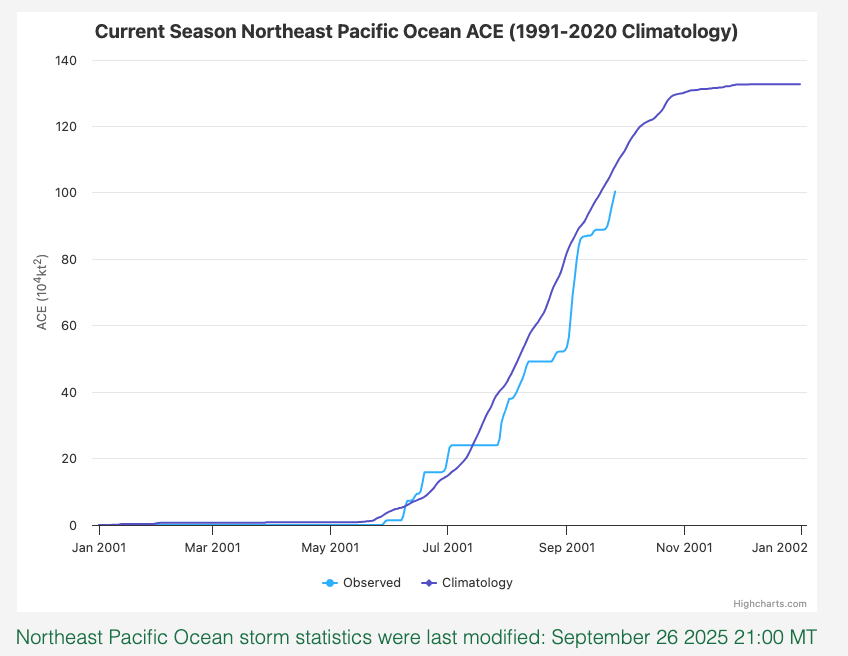
Figure 11
Tropical Activity Expected to Remain Below Average as Pacific Seasons Wind Down
The western Pacific is approaching the end of the peak typhoon season, while the eastern Pacific hurricane season continues until 30 November. Although climatological conditions may become less favourable for tropical development, it remains possible that suitable conditions could occur in specific areas, allowing additional tropical systems to form before the seasons conclude, potentially posing risks on land and at sea.
However, with the ENSO phase remaining neutral, or potentially leaning towards a La Niña phase, and sea surface temperatures beginning to fall during autumn, tropical activity is likely to remain below average in both the eastern and western Pacific. This is supported by Figure 12 The team at FleetWeather provides 24/7/365 monitoring across the world to ensure safe and efficient weather routing for vessels. Please reach out to the team of accredited marine routers at any time to activate Pole Star Global’s weather routing and forecast services. Pole Star Global is committed to delivering optimum guidance to help your vessels navigate safely through tropical cyclones or any other adverse weather conditions. Stay connected and safe.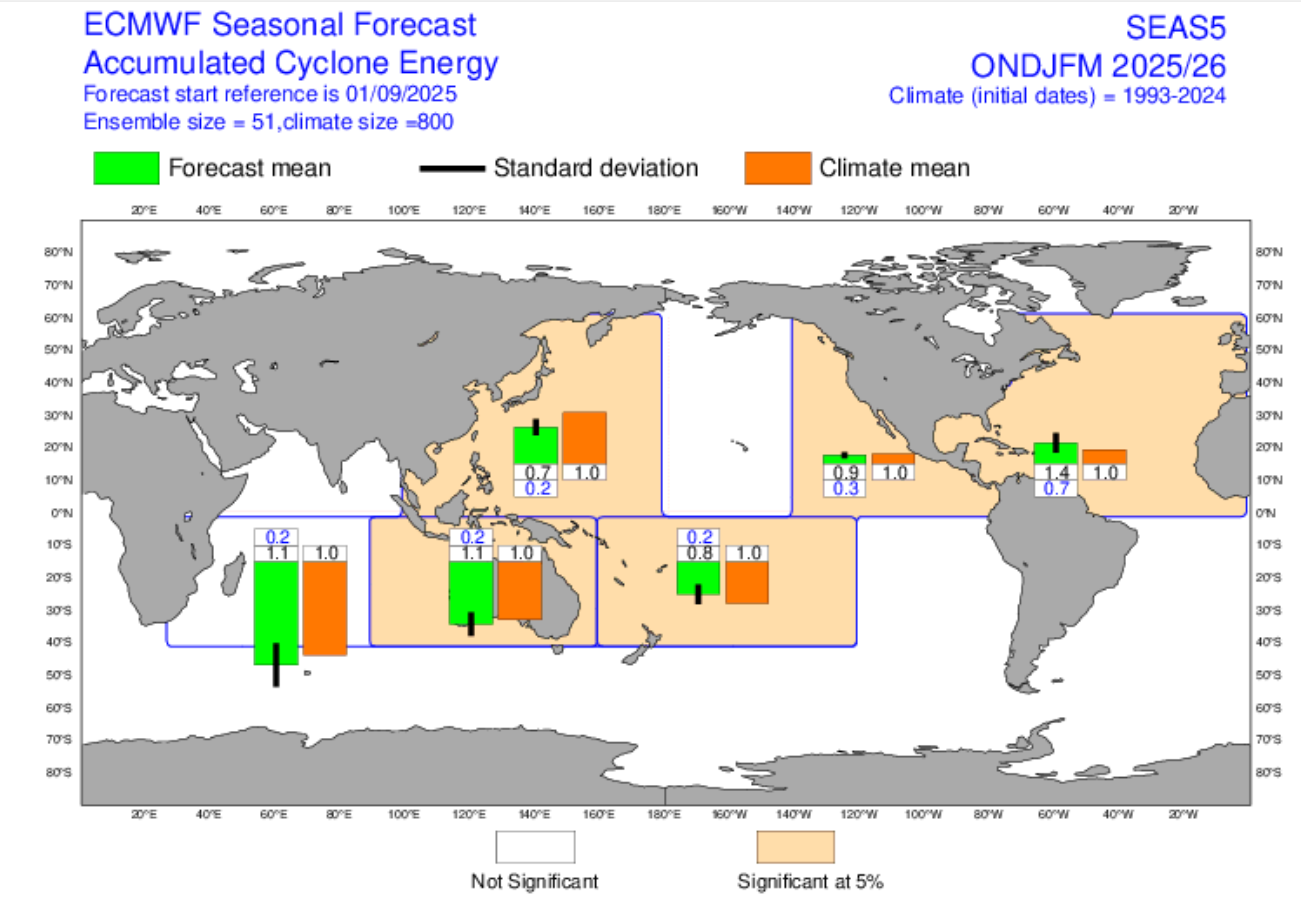
Author
![]() Raymond Jefferson is from Cape May Court House, New Jersey and has a Bachelor of Science degree in the field of Meteorology from Rutgers University. An accredited Meteorologist (RMet), he has been with Fleetweather since December 2014 and is currently a Marine Router on the Atlantic Orcas watch.
Raymond Jefferson is from Cape May Court House, New Jersey and has a Bachelor of Science degree in the field of Meteorology from Rutgers University. An accredited Meteorologist (RMet), he has been with Fleetweather since December 2014 and is currently a Marine Router on the Atlantic Orcas watch.
About Pole Star Global’s FleetWeather Operations Center
Pole Star Global’s FleetWeather Operations Center is a trusted team of RMetS-accredited marine meteorologists and maritime experts, delivering 24/7 weather routing and forecasting, charter party compliance and claims guidance services to the global shipping industry. With over 50 years of experience, they provide both expert advisory and automated solutions to optimise voyage performance, reduce fuel use and emissions, and enhance safety. Their full range of services includes bespoke shoreside and shipside forecasts, advanced seakeeping alerts, multi-route comparisons, and AI-powered optimisation through the Podium platform.