

By Arsenio Longo, HUAX & Saleem Khan, Pole Star Global
The Strait of Hormuz is usually discussed in the language of energy security: barrels at risk, tanker traffic, naval deployments and alternative export routes. For households, the question is more immediate. When traffic through the strait is disrupted, how quickly does that disruption reach the petrol station, the electricity bill or the supermarket shelf?
There is no single multiplier that turns fewer vessel passages into a consumer-price forecast. The chain begins with the physical disruption recorded in maritime movements; commodity and freight markets then reveal how the shock is priced, while consumer-price data capture its later passage through production, transport and household spending. These stages are connected, though each measures a different part of the process.
The scale of the exposure explains why Hormuz matters. According to the US Energy Information Administration, around 20 million barrels per day of oil and petroleum products passed through the strait in the first half of 2025, equivalent to about one-fifth of global petroleum-liquids consumption and more than one-quarter of seaborne oil trade. Around one-fifth of global liquefied natural gas trade also used the route, mostly from Qatar.
The 2026 closure showed how quickly this physical dependency could turn into a pricing event. The EIA described the strait as effectively closed from 28 February, with disrupted oil flows, production shut-ins and sharp price volatility. Following an 18 June memorandum between the United States and Iran, traffic recovered. In its 7 July outlook, the EIA raised its global production forecast after Brent had averaged $85 a barrel in June, $22 below May.
That recovery, however, did not hold. Three commercial vessels were attacked on the day the outlook was published, leading JMIC to raise the regional threat level to “severe”. Visible traffic fell sharply thereafter. JMIC recorded 24 and 25 transits on 5 and 6 July against a historical average of about 138, and HUAX analysis identified only six visible crossings by Sunday 12 July, while many vessels reduced or suspended AIS (Automatic Identification System) transmissions in the high-risk area. Iran declared the strait closed; Washington insisted it remained open. Whatever the outcome of that dispute over control, the recovery embedded in the EIA’s 7 July forecast had already unraveled within days.
These figures require some care: public AIS misses vessels that reduce or suspend transmissions, and official statements from either side are not the same as independently observed outcomes. The observable pattern, however, was clear.
Pole Star Global’s maritime intelligence platforms tracked the 2026 Hormuz disruption in real time, recording the collapse in visible strait transits from a historical average of around 138 per day to as few as six by 12 July, a drop of over 95 per cent. This kind of granular, independently observed shipping data is precisely what distinguishes maritime intelligence from official statements or market speculation: it captures the physical disruption as it happens, often days or weeks before its effects surface in commodity benchmarks or government statistics. When vessels reduce or suspend AIS transmissions in a high-risk area, the gap between what is officially declared and what is actually occurring widens — and that gap is where decision-makers are most exposed.
As the data spanning five decades of shipping shocks makes clear below, the relationship between maritime disruption and consumer-price inflation is real. The 1970s oil crises added 5–6 percentage points to headline inflation; the 2021 Suez blockage and 2024 Red Sea attacks each contributed under a percentage point. Hormuz in 2026 sits between these extremes because it combines supply loss, route denial and security risk simultaneously, a combination no previous disruption has matched at this scale. For analysts, insurers and policymakers, the lesson is that observable vessel movements remain the earliest and most reliable leading indicator in the inflationary chain, and the one least subject to political framing from any side.
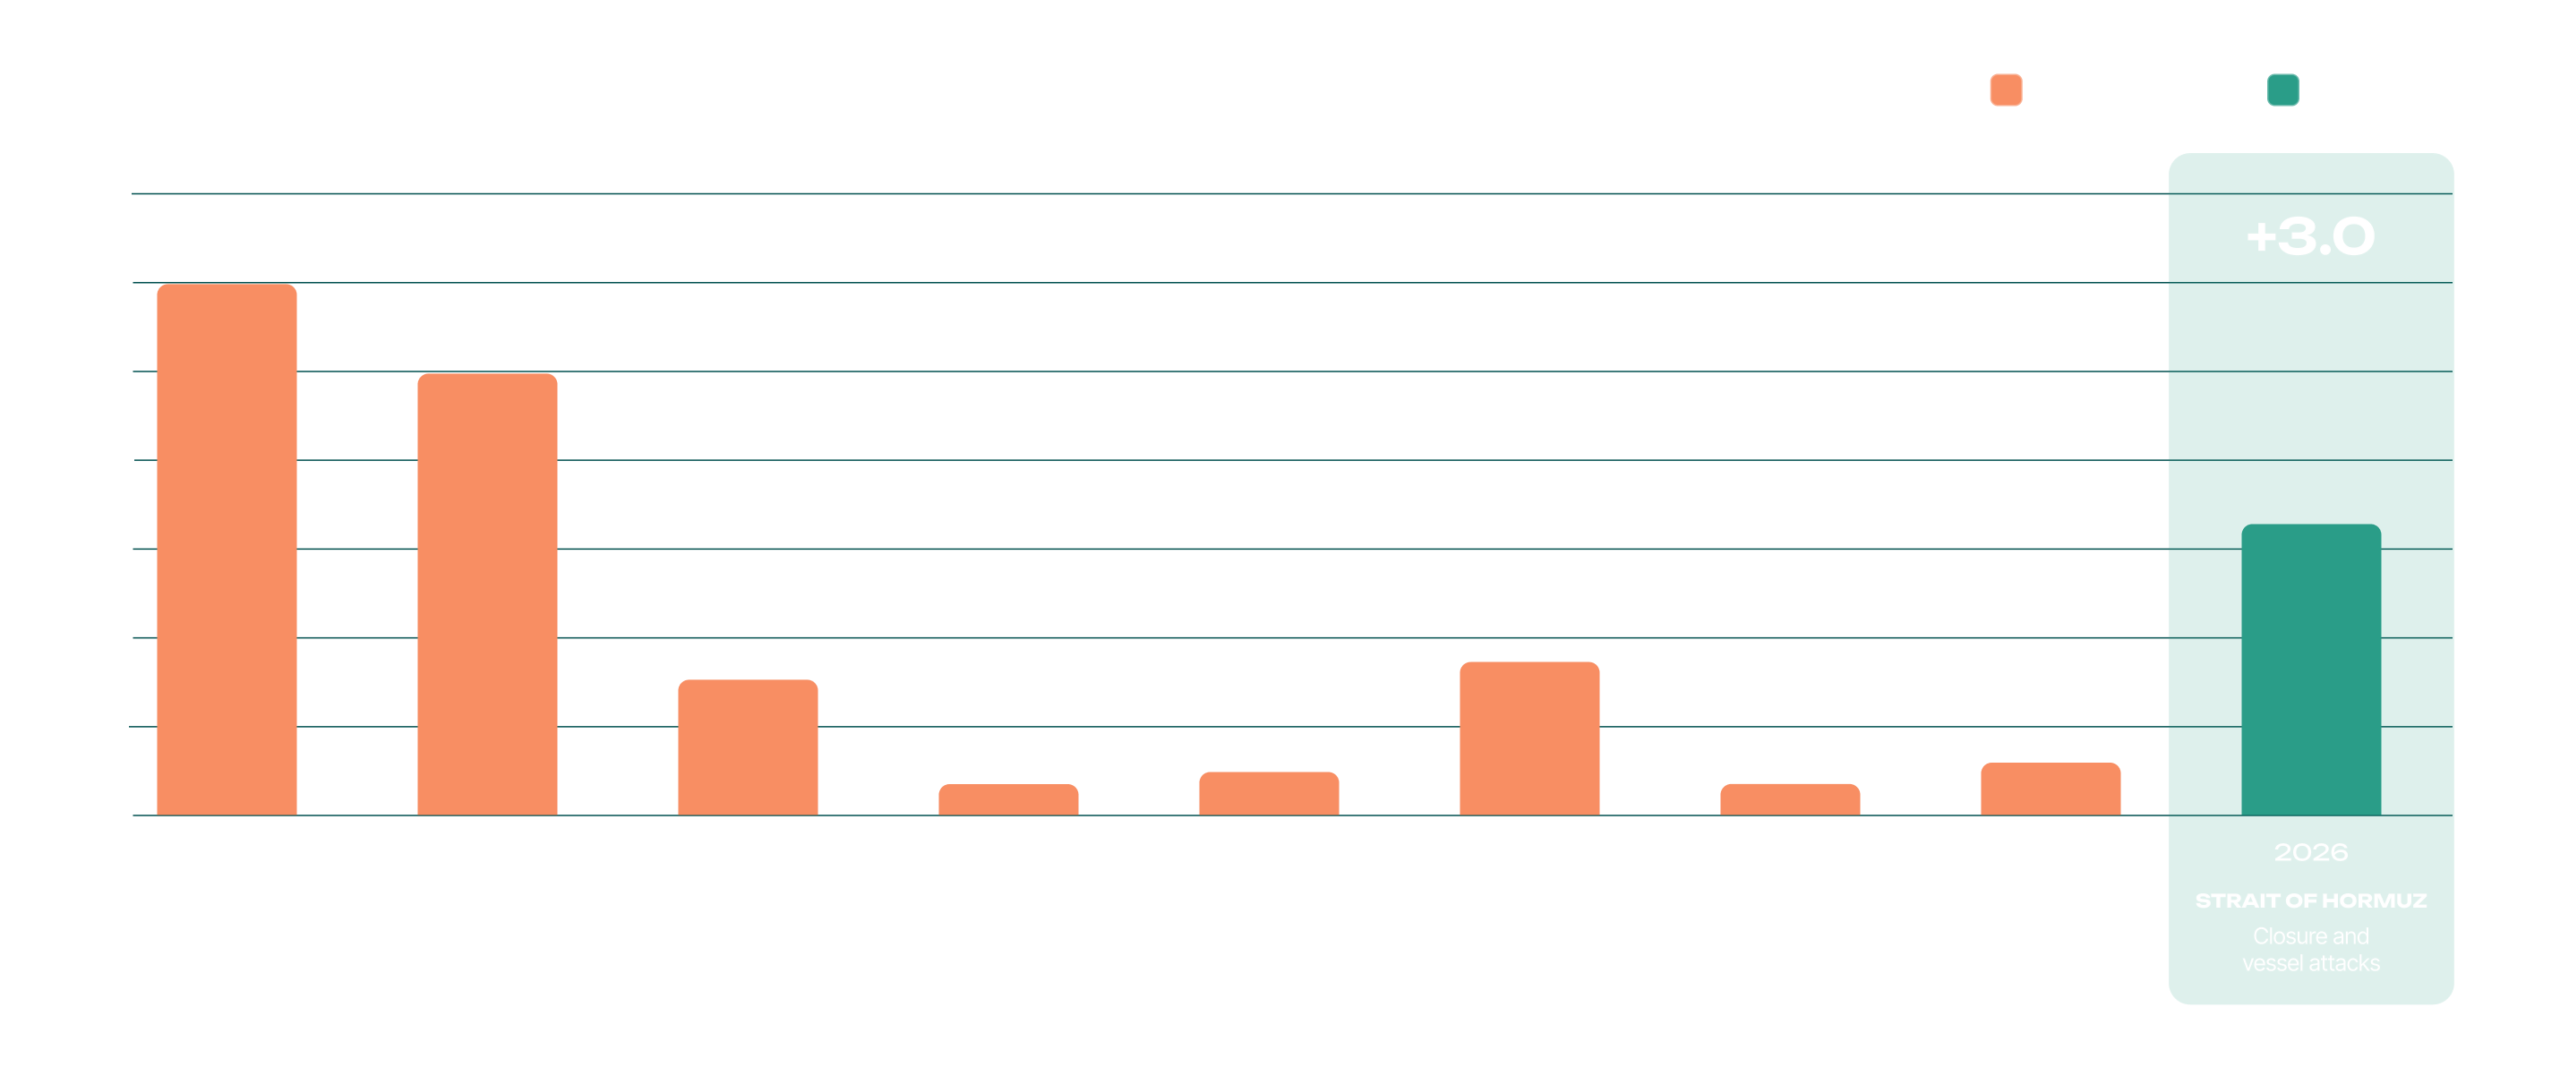
Hormuz can create two price shocks at once: it can make energy itself scarcer while also making the movement of energy and other goods more expensive.
This is the real value of maritime intelligence: it can show physical disruption before it reaches official statistics, and it can show how quickly energy markets reprice that risk. Tracing how far the shock travels through the wider economy means following several distinct channels, each moving on its own timeline.
The most direct channel runs through energy consumption. Higher crude prices feed almost immediately into wholesale petrol, diesel, heating oil and aviation fuel, though how quickly that reaches households depends on national market structures, hedging arrangements, regulated tariffs and government intervention. Fuel prices can respond within days or weeks, while electricity and gas bills may adjust only when contracts or regulated tariffs are reset. Price caps can delay the household effect, but shift part of the cost to public budgets rather than removing it.
A second channel runs through production and logistics, as firms pay more for power, transport, petrochemicals, packaging and imported inputs. These costs typically reach producer prices before they reach shop shelves, since firms tend to absorb part of a shock for a period before renegotiating supplier contracts or repricing their own output; the lag between an input-cost shock and its full effect on consumer prices is usually measured in months rather than days, as the historical evidence below suggests.
Food follows a longer and more consequential chain. The International Monetary Fund estimates that about one-third of global fertiliser trade normally passes through Hormuz. Unlike petrol prices, the food effect may take a season to emerge: fertiliser costs first affect farmers’ margins and planting decisions, then harvest volumes, and only later wholesale and retail prices. The eventual effect also depends on inventories, alternative suppliers and government support, and it falls hardest on economies where food already makes up a large share of household spending: food accounts for about 43 per cent of consumption in low-income developing countries, against 25 per cent in emerging markets and 12 per cent in advanced economies, according to IMF estimates.
In the euro area, the link is no longer purely theoretical, although the monthly path is not one-directional. Inflation rose from 3.0 per cent in April to 3.2 per cent in May before Eurostat’s flash estimate eased to 2.8 per cent in June; energy inflation nevertheless remained elevated at 8.7 per cent. The European Central Bank projected average inflation of 3.0 per cent for 2026, mainly because of higher energy prices, and expected indirect effects to spread gradually beyond the energy component.
Historical disruptions help clarify the mechanism, although none offers a ready-made Hormuz formula.
Somali piracy around 2008–2012 offers one useful comparison. It was primarily a security-risk shock: research using individual dry-bulk shipping contracts found that the rise in attacks in 2008 raised shipping costs on exposed routes by around 10 per cent, while the World Bank later estimated the wider annual trade cost — including insurance, additional fuel and route changes — at roughly $18 billion. The additional cost reflected the danger of using a route that remained open, rather than a loss of transport capacity or energy supply. Its effect on global consumer-price inflation, however, cannot be isolated cleanly.
The Ever Given blockage in March 2021 exposed a different mechanism: the sudden loss of transport capacity. By blocking the Suez Canal for almost a week, the grounded container ship intensified delays in a system already strained by pandemic congestion and container shortages. UNCTAD later estimated that the broader container-freight surge of that period could leave global consumer price levels 1.5 per cent higher in 2023 than they otherwise would have been. That estimate captures the wider and longer-lasting freight crisis, not the effect of the six-day blockage in isolation.
IMF research across 120+ countries offers a more general guide. It found that when global freight rates double, inflation rises by about 0.7 percentage points on average, with the effect peaking after roughly a year and lasting up to 18 months. Shipping costs reach import and producer prices before their full effect appears at the cash register. This points to a lagged general mechanism rather than a conversion rate that could be applied directly to Hormuz traffic.
Hormuz goes beyond both precedents. A serious disruption can raise the cost of safe passage while also constraining the supply of the energy being transported. That combination makes the transmission broader and, for fuel prices, considerably faster.
Reliable maritime analysis should focus on actual gate crossings, distinguish energy cargoes and laden movements where the evidence permits, use transparent baselines and disclose coverage limits. Maritime behavior can establish whether flows are being disrupted; market data show how the disruption is valued, while official inflation series reveal how far its effects have reached households.
AIS does not measure inflation. It can, however, reveal the physical beginning of an inflationary chain before its full effect appears in the shopping basket.